Machine learning
Weather forecasting for 2020-2021 NAHA WMO Japan weather station using Random Forest Regression.


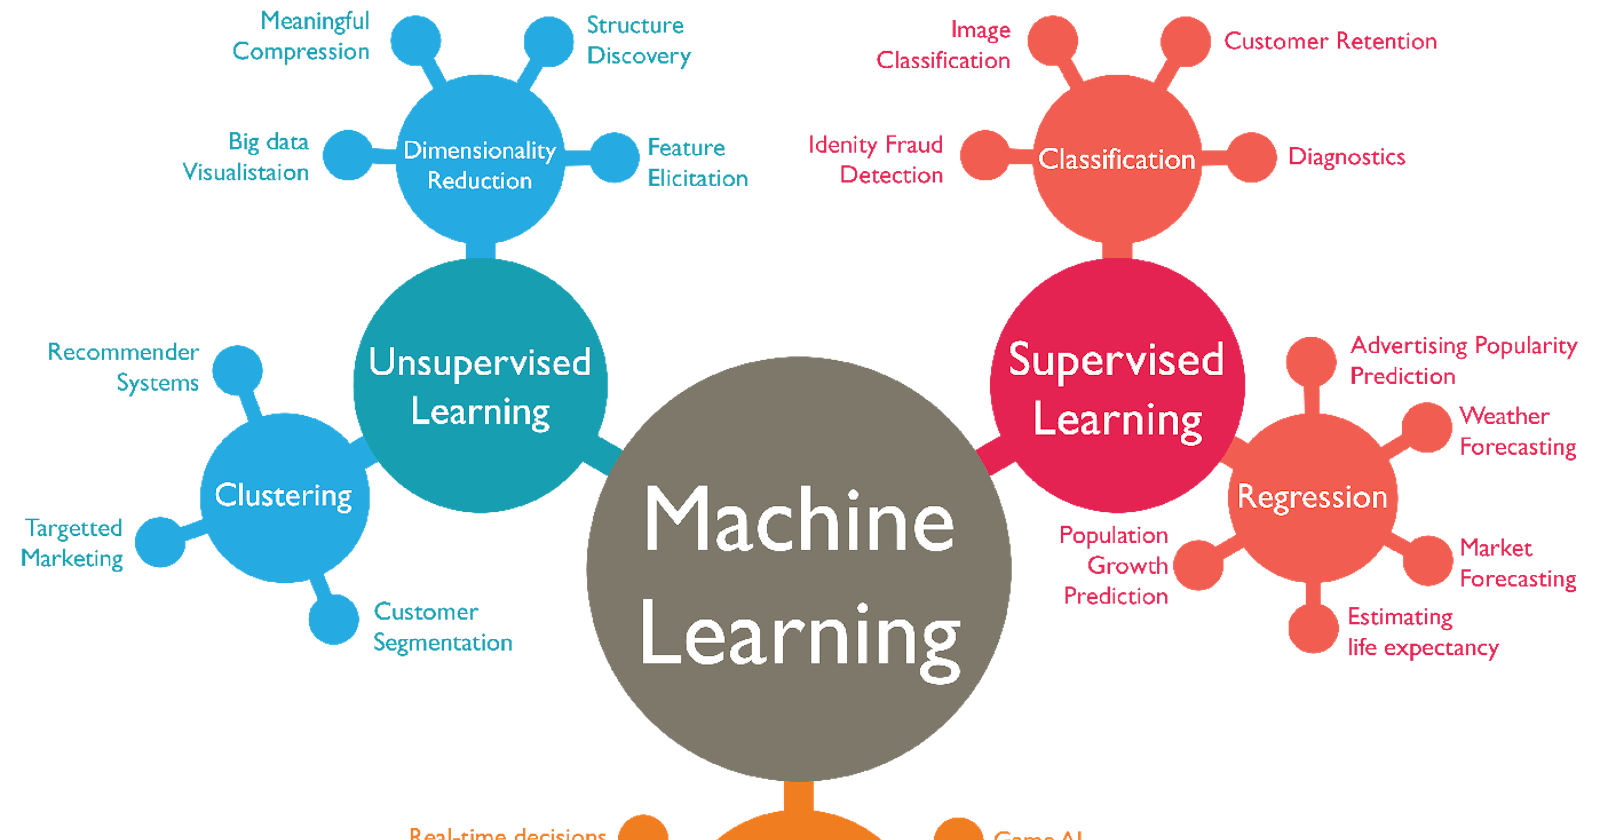
Machine learning is divided into; supervised and unsupervised learning. Supervised learning is the machine learning task of learning a function that maps an input to an output based on example input-output pairs. In this project I used Random forest regression which is supervised learning algorithm that uses ensemble learning method for regression. Ensemble learning method is a technique that combines predictions from multiple ML algorithms to make a more accurate prediction than a single model.
Libraries used; Libraries are extension of a programming language with a compiled function/files/class or variables. The list of the python libraries used in the project includes:
I) pandas ~ pandas is a library in Python for data manipulation and analysis. In particular, it offers data structures and operations for manipulating numerical tables and time series.
II)scikitlearn: Sk-learn is a python machine learning library that implements many commonly used ML Algorithms. (TimeSeries) ~Timeseries algorithms are used extensively for analyzing and forecasting time-based data.
III)KNeighborsRegressor ~In k-NN regression, the k-NN algorithm is used for estimating continuous variables.
Iv)RandomForestRegressor~A random forest is a meta-estimator that fits a number of classifying decision trees on various sub-samples of the dataset and uses averaging to improve the predictive accuracy and control over-fitting. The sub-sample size is controlled with the max_samples parameter if bootstrap=True (default), otherwise the whole dataset is used to build each tree.
V) Matplotlib. Matplotlib is a python plotting library ~ {Seaborn} helps you explore and understand your data. Its plotting functions operate on dataframes and arrays containing whole datasets and internally perform the necessary semantic mapping and statistical aggregation to produce informative plots. Its dataset-oriented, declarative API lets you focus on what the different elements of your plots mean, rather than on the details of how to draw them.
For the project, I plotted a bar chart with matplotlib that shows predictions for the predicted outcomes for the features; precipitation, mean air temperature, mean relative humidity, percentage possible sunshine, total sunshine duration, solar radiation & mean wind speed. The graph shows weather predictions for 2020-2021.
A piece of advise to take note of when working on machine learning project is avoid information overload. As much as it's good to be fully equipped with the knowledge of the model & libraries you're going to use, do not gain so much information that you don't know which to act upon, I came to find out trying what does not work & replacing with what works is eventually how you finish a project other than exploring so much & not acting upon it.
Below is the project repository link. Download zip {extract from zip folder} & open via Jupyternotebook by selecting python 3 & click on files, select NAHA-WMO-station from Downloads. You"ll find in terminal useful #comments that helps explain each cell for every features predicted.